


DATA VISUALIZATION DESIGN
CREATIVE CHALLENGE:
Select a subject matter of interest, perform research, and gather a significant amount of data. Write a proposal for the topic. Analyze the data and convert it into two distinctly different infographic-style visual outcomes.
Select a subject matter of interest, perform research, and gather a significant amount of data. Write a proposal for the topic. Analyze the data and convert it into two distinctly different infographic-style visual outcomes.
DELIVERABLES:
Journalistic Infographic, described as: Data driven; Simplified; Narrative; Smaller data set; Easy to understand; Informative; Accessible; Interactive; Organized; Digestible; Understandable
Artistic Infographic, described as: Conceptual; Explorative; Limited venue; Creative; Cultural commentary; Unnecessary; Small data set; Aesthetic; New

Journalistic-style Infographic
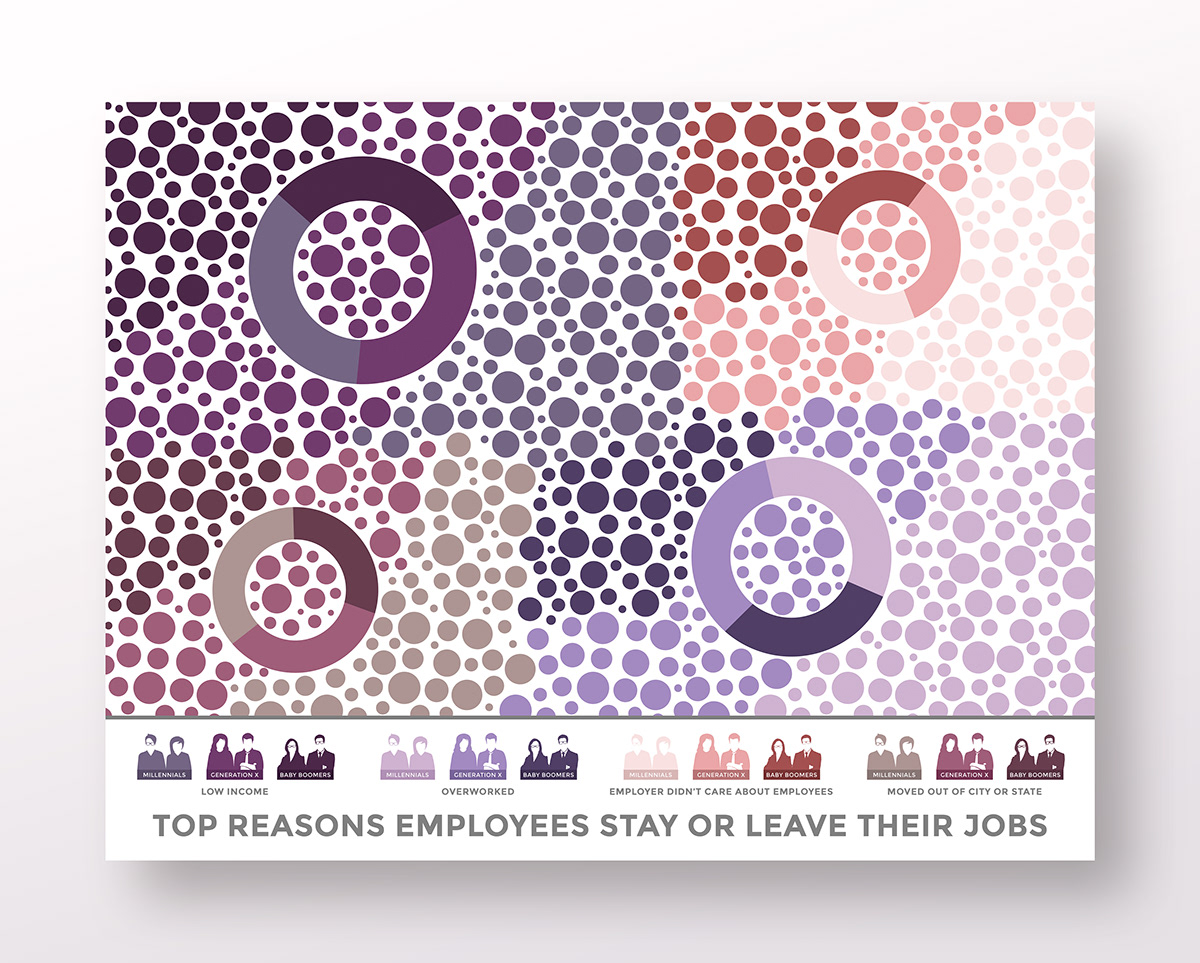
Artistic-style Infographic

THE PROCESS DOCUMENTATION
PROJECT PROPOSAL
Here is the written proposal.


THE DATA: JOURNALISTIC
Here is some of the supporting data snippets and analysis.


CONCEPTUALIZATION: JOURNALISTIC
Here are some concepts and quick sketches.


FINAL OUTCOME AND NOTES: JOURNALISTIC
Here is the final outcome with my notes on the findings.

THE DATA: ARTISTIC
Here is some of the supporting data snippets and analysis.


CONCEPTUALIZATION: ARTISTIC
Here are some concepts and quick sketches.


FINAL OUTCOME AND NOTES: ARTISTIC
Here is the final outcome with an unexpected in-context placement.


